quarta-feira, 28 de outubro de 2015

Namespace Planning in Exchange 2016

If you are like the vast majority of our customers, you already have some version(s) of Exchange deployed in your environment. Depending on the version, you may have different namespace requirements today.

Exchange 2010

Exchange 2010 leverages the Autodiscover service for enabling client profile changes, so that namespace exists.
Exchange 2010 introduced additional namespace requirements, which resulted in additional complexity around namespace planning, especially for site resilient solutions:
  1. Primary datacenter Internet protocol namespace (mail.contoso.com)
  2. Secondary datacenter Internet protocol namespace (mail2.contoso.com)
  3. Primary datacenter Outlook Web App failback namespace (mailpri.contoso.com)
  4. Secondary datacenter Outlook Web App failback namespace (mailsec.contoso.com)
  5. Transport namespace (smtp.contoso.com)
  6. Primary datacenter RPC Client Access namespace (rpc.contoso.com)
  7. Secondary datacenter RPC Client Access namespace (rpc2.contoso.com)
Out of these seven namespaces, five of them were required on certificates. The RPC Client Access namespaces were not required on the certificate because they were accessed via RPC connectivity and not via an Internet-based protocol, like HTTP.

Exchange 2016

One of the benefits of the Exchange 2016 architecture (first introduced in Exchange 2013) is that the namespace model can be simplified, when compared to Exchange 2010.
An example of how it can be simplified can be seen when thinking about a site resilience scenario. If you have two datacenters participating in a site resilient architecture, by replacing the Exchange 2010 infrastructure with Exchange 2016, five namespaces could potentially be removed:
  1. Secondary datacenter Internet protocol namespace (mail2.contoso.com)
  2. Primary datacenter Outlook Web App failback namespace (mailpri.contoso.com)
  3. Secondary datacenter Outlook Web App failback namespace (mailsec.contoso.com)
  4. Primary datacenter RPC Client Access namespace (rpc.contoso.com)
  5. Secondary datacenter RPC Client Access namespace (rpc2.contoso.com)
There’s two reasons for this.
First, Exchange 2016 no longer leverages an RPC Client Access namespace.This is due to the architectural changes within the product - for a given mailbox, the protocol that services the request is always going to be the protocol instance on the Mailbox server that hosts the active copy of the database for the user’s mailbox. In other words, the RPC Client Access service is no longer decoupled from the store, like it was in Exchange 2010.
Second, as mentioned, the Client Access services proxies requests to the Mailbox server hosting the active database copy.
npfig1
Figure 1: Client Access services (on MBX Server 1) proxying traffic to the Mailbox server hosting the active database copy (on MBX Server 3)
This proxy logic is not limited to the Active Directory site boundary. Unlike Exchange 2010, Exchange 2016 does not require the client namespaces to move with the DAG during an activation event – a Mailbox server in one Active Directory site can proxy a session to a Mailbox server that is located in another Active Directory site. This means that unique namespaces are no longer required for each datacenter (mail.contoso.com and mail2.contoso.com); instead, only a single namespace is needed for the datacenter pair – mail.contoso.com. This also means failback namespaces are also not required during DAG activation scenarios, so mailpri.contoso.com and mailsec.contoso.com are removed.

Namespace Models

Depending on your architecture and infrastructure you have two choices:
  1. Deploy a unified namespace for the site resilient datacenter pair (unbound model).
  2. Deploy a dedicated namespace for each datacenter in the site resilient pair (bound model).
It’s also worth mentioning that these choices are also tied to the DAG architecture.

Unbound Model

In an unbound model, you have a single DAG deployed across the datacenter pair. This DAG has Mailbox servers in each datacenter – typically all Mailbox servers are active and host active database copies, however you could deploy all active copies in a single datacenter. Mailboxes for both datacenters are dispersed across the mailbox databases within this DAG. In this model, clients can connect to both datacenters in the event there is a WAN failure – neither datacenter’s connectivity is a boundary, hence the term unbound. It does not guarantee, however, the connectivity provides users an equal experience; meaning one connection may provide a better user experience because it has lower latency or more bandwidth.
In an unbound model, a single namespace is preferred because either datacenter can service the user request. This means that from a load balancing perspective, the Exchange 2016 Mailbox servers in both datacenters participate in handling traffic, as seen in the following diagram, where VIP (virtual IP address) is the load balanced IP address associated with the namespace:
npfig2
Figure 2: Single Namespace used across Site Resilient Datacenter Pair (Unbound Model)
As a result, for a given datacenter, the expectation is that 50% of the traffic will be proxied from the other datacenter.

Bound Model

As its name implies, in a bound model, users are associated (or bound) to a specific datacenter. In other words, there is preference to have the users operate out of one datacenter during normal operations and only have the users operate out of the second datacenter during failure events. There is also a possibility that users do not have equal connectivity to both datacenters. Typically, in a bound model, there are two DAGs deployed in the datacenter pair. Each DAG contains a set of mailbox databases for a particular datacenter; by controlling where the databases are mounted, you control connectivity.
In a bound model, multiple namespaces are preferred, two per datacenter (primary and failback namespaces), to prevent clients trying to connect to the datacenter where they may have no connectivity. Switchover to the other datacenter is a controlled event.
npfig3
Figure 3: Multiple Namespaces used across Site Resilient Datacenter Pair (Bound Model)

Autodiscover Namespace

Exchange 2016 takes advantage of the Autodiscover service for client profile configuration; so the autodiscover.contoso.com namespace remains in place.

Office Online Server Namespaces

The document collaboration features included in Outlook on the web require Office Online Server. In site resilient deployments, you want to deploy an Office Online Server farm in each datacenter that participates in the site resilient datacenter pair.This ensures that there is a local instance that can service the document collaboration requests for the local mailboxes and avoids cross-site proxy scenarios.
From a namespace perspective, this means that each datacenter in the site resilient datacenter pair requires a unique namespace for Office Online Server; in other words, the namespace model for Office Online Server is a bound model.The namespace model that is used by Office Online Server is mutually exclusive from the model used by Exchange, meaning that you can deploy Exchange using an unbound model, while utilizing a bound model for Office Online Server as seen in the following figure:
 npfig4
Figure 4: Office Online Server Namespaces (Bound Model) with an Exchange Unbound Model Namespace
As all the data serviced by Office Online Server is either stored in Exchange or SharePoint, during a datacenter outage, namespace manipulation steps are not required. For example, if we refer to the previous diagram – if the West datacenter fails, you don’t need to change the DNS record for the Office Online Server namespace in West and point it to the load balancer in East. This is due to the architecture of Exchange and Office Online Server. Any Exchange 2016 Mailbox server will always proxy the client’s request to the Mailbox server that hosts the user’s mailbox database. The Mailbox server hosting the user’s mailbox is responsible for generating the Office Online Server URL that is used by OWA. This URL is defined per-Mailbox server, thereby ensuring that any Office Online Server interactions are always local to the Mailbox server.

Internal vs. External Namespaces

Since the release of Exchange 2007, the recommendation is to deploy a split-brain DNS infrastructure for the Internet-based client namespaces.A split-brain DNS infrastructure enables different IP addresses to be returned for a given namespace based on where the client resides – if the client is within the internal network, the IP address of the internal load balancer is returned; if the client is external, the IP address of the external gateway/firewall is returned.
This approach simplifies the end-user experience – users only have to know a single namespace (e.g., mail.contoso.com) to access their data, regardless of where they are connecting. A split-brain DNS infrastructure, also simplifies the configuration of the Exchange virtual directories, as the InternalURL and ExternalURL values within the environment can be the same value.
In the event that you do not deploy a split-brain DNS (also known as split-DNS) infrastructure, Exchange 2016 does allow you to specify different namespaces for internal clients vs. external clients for all clients.
Important: In the event that you are utilizing a split-brain DNS infrastructure, then you must utilize the same authentication value for both your internal and external Outlook Anywhere settings, or switch to use different names for Outlook Anywhere inside and out. Outlook gives priority to the internal settings over the external settings and since the same namespace is used for both, regardless of whether the client is internal or external, it will utilize only the internal authentication settings.

Regional Namespace

The concept of regional namespaces has existed since OWA debuted in 1997. A regional namespace is a way for clients to connect to the client access endpoint that is closest to the Mailbox servers hosting the data.
Use of a regional namespace does not necessarily mean you are restricted to a bound model, either. This is because depending on your infrastructure and network capabilities, you may choose to have a dedicated namespace for each datacenter pair. For example, your company may have a set of datacenters in North America and in Europe, and due to a desire to reduce cross-region network traffic, you deploy a dedicated namespace for each region (notice that within a region, the unbound model is used):
npfig5
Figure 5: : Regional Namespaces coupled with Geo-DNS to Round-Robin between Datacenters within a Region

Namespaces and Active Directory Site Topologies

When planning your namespace architecture, it is important to understand that namespaces and authentication settings must be identical and/or consistent within an Active Directory site. For example, when Autodiscover generates a response to send to the client, it generates a list of internal URLs based on the virtual directory settings of the Mailbox servers located in the Active Directory where the mailbox is located. If you attempt to have multiple namespaces within a single Active Directory site, clients will be randomly directed to different namespaces. Likewise, setting different authentication settings within an Active Directory site will lead to different behaviors for the clients. In other words, you can only define different namespace and authentication settings between Active Directory sites, not within Active Directory sites.

Conclusion

Exchange 2016 introduces significant flexibility in your namespace architecture, enabling deployment of a single unified namespace for a site resilient datacenter pair (or worldwide), or deployment of multiple namespaces.  As we delve into the intricacies surrounding load balancing principles and client connectivity, you will understand (hopefully) how to choose the best namespace model.
FONTE Ross Smith IV

Exchange 2016 Coexistence with Kerberos Authentication


With the release of Exchange Server 2016, I thought it would be best to document our guidance around utilizing Kerberos authentication for MAPI clients. Like with the last two releases, the solution leverages deploying an Alternate Service Account (ASA) credential so that domain-joined and domain-connected Outlook clients, as well as other MAPI clients, can utilize Kerberos authentication.
Depending on your environment, you may utilize a single ASA or have multiple ASA accounts during the coexistence period.

Exchange 2016 Coexistence with Exchange 2010

Two ASA credentials will be utilized in this environment. One ASA credential will be assigned to Exchange 2010 and host the exchangeMDB, ExchangeRFR, and ExchangeAB SPNs, while a second ASA credential will be assigned to Exchange 2016 and host the http SPN records.
For more information, see the Exchange 2013 and Exchange 2010 Coexistence with Kerberos Authentication article.

Exchange 2016 Coexistence with Exchange 2013

A single ASA credential will be utilized and configured on all Exchange 2013 and Exchange 2016 servers.
For more information, see the Exchange 2013 Configuring Kerberos authentication for load-balanced Client Access servers article.
Note: The RollAlternateserviceAccountCredential.ps1 script included in Exchange 2016 scripts directory utilizes the new cmdlets, Get/Set-ClientAccessService. This cmdlet will not execute correctly on Exchange 2013 servers. Use the RollAlternateserviceAccountCredential.ps1 script included in Exchange 2013 scripts directory to deploy the ASA across Exchange servers.

Exchange 2016 Coexistence with both Exchange 2010 and Exchange 2013

Two ASA credentials will be utilized in this environment. One ASA credential will be assigned to Exchange 2010 and host the exchangeMDB, ExchangeRFR, and ExchangeAB SPNs, while a second ASA credential will be assigned to the Exchange 2013 and Exchange 2016 servers to host the http SPN records.
For more information, see the Exchange 2013 and Exchange 2010 Coexistence with Kerberos Authentication article.
Ross Smith IVd


Fonte: Ross Smith IV

segunda-feira, 19 de outubro de 2015

Windows 10 Upgrade ERRO 80240020

ERRO 80240020 RESOLVIDO!

Pra quem tiver baixado os arquivos pelo Windows Update e no momento da instalação aparece o erro 80240020, faça o seguinte:

1º - O erro não está relacionado com arquivos corrompidos;
2º - No campo "pesquisa" ou no "executar" digite: "regedit" (sem aspas);
3º - Irá abir o Editor de Registro;
4º - Localize a chave do Registro: [ HKEY_LOCAL_MACHINE \ SOFTWARE \ Microsoft \ Windows \ CurrentVersion \ WindowsUpdate \ OSUpgrade ];
5º - Esse caminho já deve existir em sua máquina (caso contrário crie as pastas);
6º - Crie um novo Valor DWORD (32 bits) com o seguinte nome: "
AllowOSUpgrade" (sem aspas);
7º - Marque a opção "Hexadecimal" e digite o valor: "1" (sem aspas);
8º - Deverá aparecer o seguinte valor no novo registro criado: 0x00000001;
9º - Feche o Editor de Registro e abra o Windows Update (deixe a janela aberta);
10º - Abra o prompt de comando (digite cmd no campo pesquisar ou executar) como Administrador;
11º - Cole no prompt de comando o seguinte: wuauclt.exe / UpdateNow (não tecle Enter ainda);
12º - Na tela do Windows Update clique em "Procurar atualizações";
13º - Nesse momento volte para o prompt de comando e tecle Enter;
14º - Feito isso, o Windows Update poderá baixar alguns arquivos e irá abrir a tela para iniciar a instalação da atualização para o Windows 10.

Como forçar o download e a instalação do Windows 10 no seu computador

O Windows 10 foi lançado oficialmente nesta quarta-feira (29). Mas, conforme avisou a Microsoft, nem todo mundo está na dianteira da fila para atualização. Se esse for o seu caso, veja como forçar o download do novo sistema no seu PC, desde que você tenha realizado uma pré-reserva e, é claro, esteja usando Windows 7, 8 ou 8.1 originais. Confira o passo a passo para instalação o Windows 10.
Ele chegou! Saiba o que esperar do lançamento do Windows 10 nos PCs
Windows 10 Wallpaper criação (Foto: Reprodução/Microsoft)'Entre pela janela', 'fure fila' e instale o Windows 10 antes de todo mundo (Foto: Reprodução/Microsoft)

ATENÇÃO: Antes de prosseguir, é importante fazer um backup de todos os seus arquivos em uma mídia externa. Assim, você está a salvo caso haja qualquer imprevisto no meio do caminho – afinal, após forçar o download, a instalação do Windows 10 começa imediatamente e é inviável interrompê-la.
Passo 1. Abra o Windows Explorer e navegue até a pasta C:/Windows/SoftwareDistribution/Download;
Acesse a pasta de downloads do Windows Update (Foto: Reprodução/Paulo Alves)Acesse a pasta de downloads do Windows Update (Foto: Reprodução/Paulo Alves)
Passo 2. Selecione todos os arquivos contidos ali e apague-os da máquina. Se você vir uma mensagem pedindo permissão do administrador, clique em “Continuar” e insira sua senha;
Apague todos os itens da pasta (Foto: Reprodução/Paulo Alves)Apague todos os itens da pasta (Foto: Reprodução/Paulo Alves)
Passo 3. Abra o menu Iniciar e abra o Windows Update;
Acesse o Windows Update (Foto: Reprodução/Paulo Alves)Acesse o Windows Update (Foto: Reprodução/Paulo Alves)
Passo 4. De novo no menu Iniciar, dessa vez acesse o Prompt de Comando do Windows procurando por “cmd”;
Abra o Prompt de Comando (Foto: Reprodução/Paulo Alves)Abra o Prompt de Comando (Foto: Reprodução/Paulo Alves)
Passo 5. No Prompt, digite o comando “wuauclt.exe /updatenow” (sem as aspas). Cuidado, nesse momento você deve somente digitar SEM pressionar Enter;
Digite o comando ainda sem dar Enter (Foto: Reprodução/Paulo Alves)Digite o comando ainda sem dar Enter (Foto: Reprodução/Paulo Alves)
Passo 6. Vá até o Windows Update e clique no botão “Procurar Atualizações”. Rapidamente, volte ao Prompt e dê um Enter para inserir o comando;
Busque por atualizações do Windows e insira o comando do prompt (Foto: Reprodução/Paulo Alves)Busque por atualizações do Windows e insira o comando do prompt (Foto: Reprodução/Paulo Alves)
Passo 7. No Windows Update, você verá uma mensagem informando que o Windows 10 está sendo baixado.
Verifique o download do Windows 10 (Foto: Reprodução/Paulo Alves)Verifique o download do Windows 10 (Foto: Reprodução/Paulo Alves)
Pronto. Agora basta esperar pelo download dos pacotes de instalação e desfrutar do novo sistema em seguida. Tenha em conta que, em alguns casos, é necessário reiniciar o computador e procurar novamente por atualizações no Windows Update para que o download do Windows 10 seja efetuado.
Lembre ainda que, durante as primeiras horas em que o software “está no ar”, os servidores da Microsoft podem ficar superlotados com pedidos do mundo inteiro. Então, é importante ter paciência para obter o update sem bugs. Em alguns casos, o download demora vários minutos para sair de 0%.

Fonte: TechTudo

sexta-feira, 16 de outubro de 2015

Memory Object

The Memory performance object consists of counters that describe the behavior of physical and virtual memory on the computer. Physical memory is the amount of random-access memory (RAM) on the computer. Virtual memory consists of space in physical memory and on disk. Many of the memory counters monitor paging, which is the movement of pages of code and data between disk and physical memory. Excessive paging, a symptom of a memory shortage, can cause delays which interfere with all system processes.
Counter Name Description Counter Type
% Committed Bytes In Use shows the ratio of Memory\ Committed Bytes to the Memory\ Commit Limit. Committed memory is physical memory in use for which space has been reserved in the paging file so that it can be written to disk. The commit limit is determined by the size of the paging file. If the paging file is enlarged, the commit limit increases, and the ratio is reduced. PERF_RAW_FRACTION
Available Bytes Shows the amount of physical memory, in bytes, available to processes running on the computer. It is calculated by summing adding the amount of space on the zeroed, free, and standby memory lists. Free memory is ready for use; zeroed memory consists of pages of memory filled with zeros to prevent later processes from seeing data used by a previous process; standby memory is memory that has been removed from a process's working set (its physical memory) en route to disk but is still available to be recalled. PERF_COUNTER_RAWCOUNT
Available KBytes Shows the amount of memory available to processes running on the computer, in kilobytes rather than bytes, as reported by Memory\Available Bytes. PERF_COUNTER_RAWCOUNT
Available MBytes Shows the amount of memory available to processes running on the computer, in megabytes rather than bytes, as reported by Memory\Available Bytes. PERF_COUNTER_RAWCOUNT
Cache Bytes Shows the sum of the values of System Cache Resident Bytes, System Driver Resident Bytes, System Code Resident Bytes, and Pool Paged Resident Bytes. PERF_COUNTER_RAWCOUNT
Cache Bytes Peak Shows the maximum number of bytes used by the file system cache since the system was last restarted. This might be larger than the current size of the cache. PERF_COUNTER_RAWCOUNT
Cache Faults/sec hows the rate at which faults occur when a page sought in the file system cache is not found and must be retrieved from elsewhere in memory (a soft fault) or from disk (a hard fault). This counter shows the number of faults, without regard for the number of pages faulted in each operation. PERF_COUNTER_COUNTER
Commit Limit Shows the amount of virtual memory, in bytes, that can be committed without having to extend the paging file(s). Committed memory is physical memory which has space reserved on the disk paging files. There can be one or more paging files on each physical drive. If the paging file(s) are expanded, this limit increases accordingly. PERF_COUNTER_RAWCOUNT
Committed Bytes Shows the amount of committed virtual memory, in bytes. PERF_COUNTER_RAWCOUNT
Demand Zero Faults/sec Shows the rate at which a zeroed page is required to satisfy the fault. Zeroed pages, pages emptied of previously stored data and filled with zeros, are security features in Windows 2000 that prevent processes from seeing data stored by earlier processes that used the memory space. Windows 2000 maintains a list of zeroed pages to accelerate this process. This counter shows numbers of faults, without regard to the numbers of pages retrieved to satisfy the fault. PERF_COUNTER_COUNTER
Free System Page Table Entries Shows the number of page table entries not currently in use by the system. PERF_COUNTER_RAWCOUNT
Page Faults/sec Shows the average number of pages faulted per second. It is measured in numbers of pages faulted; because only one page is faulted in each fault operation, this is also equal to the number of page fault operations. This counter includes both hard faults (those that require disk access) and soft faults (where the faulted page is found elsewhere in physical memory). Most processors can handle large numbers of soft faults without significant consequence. However, hard faults, which require disk access, can cause delays. PERF_COUNTER_COUNTER
Page Reads/sec Shows the rate at which the disk is read to resolve hard page faults. It shows numbers of read operations, without regard to the number of pages retrieved in each operation. Hard page faults occur when a process references a page in virtual memory that is not in its working set or elsewhere in physical memory, and must be retrieved from disk. This counter is a primary indicator of the kinds of faults that cause system-wide delays. It includes read operations to satisfy faults in the file system cache (usually requested by applications) and in noncached mapped memory files. Compare the value of Page Reads/sec to the value of Pages Input/sec to find an average of how many pages were read during each read operation. PERF_COUNTER_COUNTER
Page Writes/sec Shows the rate at which pages are written to disk to free up space in physical memory. Pages are written to disk only if they are changed while in physical memory, so they are likely to hold data, not code. This counter shows write operations, without regard to the number of pages written in each operation. PERF_COUNTER_COUNTER
Pages Input/sec Shows the rate at which pages are read from disk to resolve hard page faults. Hard page faults occur when a process refers to a page in virtual memory that is not in its working set or elsewhere in physical memory, and must be retrieved from disk. When a page is faulted, the system tries to read multiple contiguous pages into memory to maximize the benefit of the read operation. Compare Pages Input/sec to Page Reads/sec to find the average number of pages read into memory during each read operation PERF_COUNTER_COUNTER
Pages Output/sec Shows the rate at which pages are written to disk to free up space in physical memory. A high rate of pages output might indicate a memory shortage. Windows 2000 writes more pages back to disk to free up space when physical memory is in short supply. This counter shows numbers of pages, and can be compared to other counts of pages without conversion. PERF_COUNTER_COUNTER
Pages/sec Shows the rate at which pages are read from or written to disk to resolve hard page faults. This counter is a primary indicator of the kinds of faults that cause system-wide delays. It is the sum of Memory\ Pages Input/sec and Memory\ Pages Output/sec. It is counted in numbers of pages, so it can be compared to other counts of pages, such as Memory\ Page Faults/sec, without conversion. It includes pages retrieved to satisfy faults in the file system cache (usually requested by applications) and noncached mapped memory files. PERF_COUNTER_COUNTER
Pool Nonpaged Allocs Shows the number of calls to allocate space in the nonpaged pool. It is measured in numbers of calls to allocate space, regardless of the amount of space allocated in each call. PERF_COUNTER_RAWCOUNT
Pool Nonpaged Bytes Shows the size, in bytes, of the nonpaged pool. Memory\ Pool Nonpaged Bytes is calculated differently than Process\ Pool Nonpaged Bytes, so it might not equal Process(_Total )\ Pool Nonpaged Bytes. PERF_COUNTER_RAWCOUNT
Pool Paged Allocs Shows the number of calls to allocate space in the paged pool. It is measured in numbers of calls to allocate space, regardless of the amount of space allocated in each call. PERF_COUNTER_RAWCOUNT
Pool Paged Bytes Shows the size, in bytes, of the paged pool. Memory\ Pool Paged Bytes is calculated differently than Process\ Pool Paged Bytes, so it might not equal Process(_Total )\ Pool Paged Bytes. PERF_COUNTER_RAWCOUNT
Pool Paged Resident Bytes Shows the current size, in bytes, of the paged pool. Space used by the paged and nonpaged pools is taken from physical memory, so a pool that is too large denies memory space to processes. PERF_COUNTER_RAWCOUNT
System Cache Resident Bytes Shows the size, in bytes, of pageable operating system code in the file system cache. This value includes only current physical pages and does not include any virtual memory pages not currently resident. It does not equal the System Cache value shown in Task Manager. As a result, this value may be smaller than the actual amount of virtual memory in use by the file system cache. This value is a component of Memory\ System Code Resident Bytes which represents all pageable operating system code that is currently in physical memory. PERF_COUNTER_RAWCOUNT
System Code Resident Bytes Shows the size, in bytes, of operating system code currently in physical memory that can be written to disk when not in use. This value is a component of Memory\ System Code Total Bytes, which also includes operating system code on disk. Memory\ System Code Resident Bytes (and Memory\ System Code Total Bytes) does not include code that must remain in physical memory and cannot be written to disk. PERF_COUNTER_RAWCOUNT
System Code Total Bytes Shows the size, in bytes, of pageable operating system code currently in virtual memory. It is a measure of the amount of physical memory being used by the operating system that can be written to disk when not in use. This value is calculated by adding the bytes in Ntoskrnl.exe, Hal.dll, the boot drivers, and file systems loaded by Ntldr/osloader. This counter does not include code that must remain in physical memory and cannot be written to disk. PERF_COUNTER_RAWCOUNT
System Driver Resident Bytes Shows the size, in bytes, of pageable physical memory being used by device drivers. It is the working set (physical memory area) of the drivers. This value is a component of Memory\ System Driver Total Bytes, which also includes driver memory that has been written to disk. Neither Memory\ System Driver Resident Bytes nor Memory\ System Driver Total Bytes includes memory that cannot be written to disk. PERF_COUNTER_RAWCOUNT
System Driver Total Bytes Shows the size, in bytes, of pageable virtual memory currently being used by device drivers. Pageable memory can be written to disk when it is not being used. It includes physical memory (Memory\ System Driver Resident Bytes) and code and data written to disk. It is a component of Memory\ System Code Total Bytes. PERF_COUNTER_RAWCOUNT
Transition Faults/sec Shows the rate at which page faults are resolved by recovering pages that were being used by another process sharing the page, or were on the modified page list or the standby list, or were being written to disk at the time of the page fault. The pages were recovered without additional disk activity. Transition faults are counted in numbers of faults; because only one page is faulted in each operation, it is also equal to the number of pages faulted. PERF_COUNTER_COUNTER
Write Copies/sec Shows the rate at which page faults are caused by attempts to write that have been satisfied by copying the page from elsewhere in physical memory. This is an economical way of sharing data since pages are only copied when they are written to; otherwise, the page is shared. This counter shows the number of copies, without regard to the number of pages copied in each operation. PERF_COUNTER_COUNTER

Monitor SQL Server using Performance Monitor on Windows Server 2008 R2

Monitor SQL Server using Performance Monitor on Windows Server 2008 R2

Skip to end of metadata Go to start of metadata

Table of Contents

  1. Open Performance Monitor (AKA perfmon)
  2. Setup the Data Collector Set
  3. Start the Data Collector Set
  4. Stop the Data Collector Set
  5. HOWTO: Change the User for the Data Collector Set
  6. HOWTO: Change the Log file Location
  7. HOWTO: Create a Data Collector Set Template
  8. HOWTO: Use a Custom Template to Create a Data Collector Set

Step 1: Open Performance Monitor (AKA perfmon)

  1. Press the Start + R keys to get the Run dialog.
  2. Type “perfmon”:
     
  3. Click the “OK” button.

Step 2: Setup the Data Collector Set

  1. Left click the arrow found to the left of "Data Collector Sets" to expand the tree:
  2. Right click "User Defined", and select "New > Data Collector Set".
  3. Specify a unique name for the Data Collector Set:
  4. Select the "Create manually (Advanced)" radio button.
  5. Click the "Next" button.
  6. Check off "Performance counter", found under the "Create data logs":
     
  7. Click the "Next" button.
  8. Click the "Add" button.
  9. OPTIONAL: If using Performance Monitor to watch a remote host.
    1. Type the hostname into the “Select counters from computer” text field:
       
    2. Press the Tab key to trigger the dialog to query the remote host specified for available counters, and refresh the list of counters (can take a couple of minutes).
  10. Scroll to "MSSQL$[appropriate instance name]: General Statistics".
  11. Click the "+" to expand the node (found to the right of "MSSQL$[appropriate instance name]: General Statistics)
     
  12. Select "User Connections".
  13. Click the "Add" button.
  14. Scroll to "MSSQL$[appropriate instance name]: Locking".
  15. Click the "+" to expand the node (found to the right of "MSSQL$[appropriate instance name]: Locking)
     
  16. Select "Average Wait Time (ms)".
  17. Select "Database" for "Instances of selected object".
  18. Click the "Add" button.
  19. Click the "OK" button.
  20. OPTIONAL: Change the log location.
  21. Click the "Next" button.
  22. OPTIONAL: Change the user account this Data Collector Set will use for credentials.
  23. Click the "Finish" button.

Step 3: Start the Data Collector Set

  1. Right click on the Data Collector Set created in Step 2.
  2. Select "Start".

Step 4: Stop the Data Collector Set

  1. Right click on the Data Collector Set created in Step 2.
  2. Select "Stop".

HOWTO: Change the User for the Data Collector Set

  1. Open Performance Monitor (See Step 1).
  2. Expand the "Data Collector Sets" node.
  3. Expand the "User Defined" node.
  4. Right click the Data Collector Set for which you wish to change the user.
  5. Select "Properties".
  6. Under the "General" tab, click the "Change" button found in the "Run As" section.
  7. Provide a username and password for the account that will be running the Data Collector Set.
  8. Click the "OK" button.
  9. Click the "Apply" button.
  10. Click the "OK" button.

HOWTO: Change the Log file Location

  1. Open Performance Monitor (See Step 1).
  2. Expand the "Data Collector Sets" node.
  3. Expand the "User Defined" node.
  4. Right click the Data Collector Set for which you wish to change the user.
  5. Select "Properties".
  6. Under the "Directory" tab, click the "Browse" button.
  7. Select the folder location in the "Browse for Folder" dialog.
  8. Click the "OK" button.
  9. Click the "Apply" button.
  10. Click the "OK" button.

HOWTO: Create a Data Collector Set Template

Once a custom Data Collector Set has been created, it can be saved as a template:
  1. Open Performance Monitor (See Step 1).
  2. Expand the "Data Collector Sets" node.
  3. Expand the "User Defined" node.
  4. Right Click on the Data Collector Set name that will be used as a template.
  5. Left click "Save Template...".
  6. Provide a file name.
  7. OPTIONAL: Browse to a folder location where the template will be stored.
The template is stored as XML, making it easily editable in any text editor (IE: Notepad, Wordpad, etc). However, the counters are not entirely editable and will likely require recreation.

HOWTO: Use a Custom Template to Create a Data Collector Set

  1. Open Performance Monitor (See Step 1).
  2. Expand the "Data Collector Sets" node.
  3. Right click "User Defined", and select "New > Data Collector Set".
  4. Specify a unique name.
  5. Select the "Create from a template (Recommended)" radio button.
  6. Click the "Next" button.
  7. Click the "Browse" button.
  8. Navigate to the folder where the custom template is located.
  9. Select the template file.
  10. Click the "Open" button.
  11. Click the "Next" button.
  12. OPTIONAL: Change the log location.
  13. Click the "Next" button.
  14. OPTIONAL: Change the user account this Data Collector Set will use for credentials.
  15. Click the "Finish" button.

SQL Server 2008 R2 Performance Monitoring

SQL Server 2008 R2 Performance Monitoring

In case you are not aware, there are several tools that SQL Server 2008 R2 provides for you as a DBA to use that allow you to monitor performance on your databases. I’ve been talking a lot about these to customers recently and will touch on this next week at the South Jersey SQL Server User group: http://bit.ly/gtponF.
Some of these tools are just there and you may not ever open them or you may be on a previous version of SQL Server.
1. Management Data Warehouse
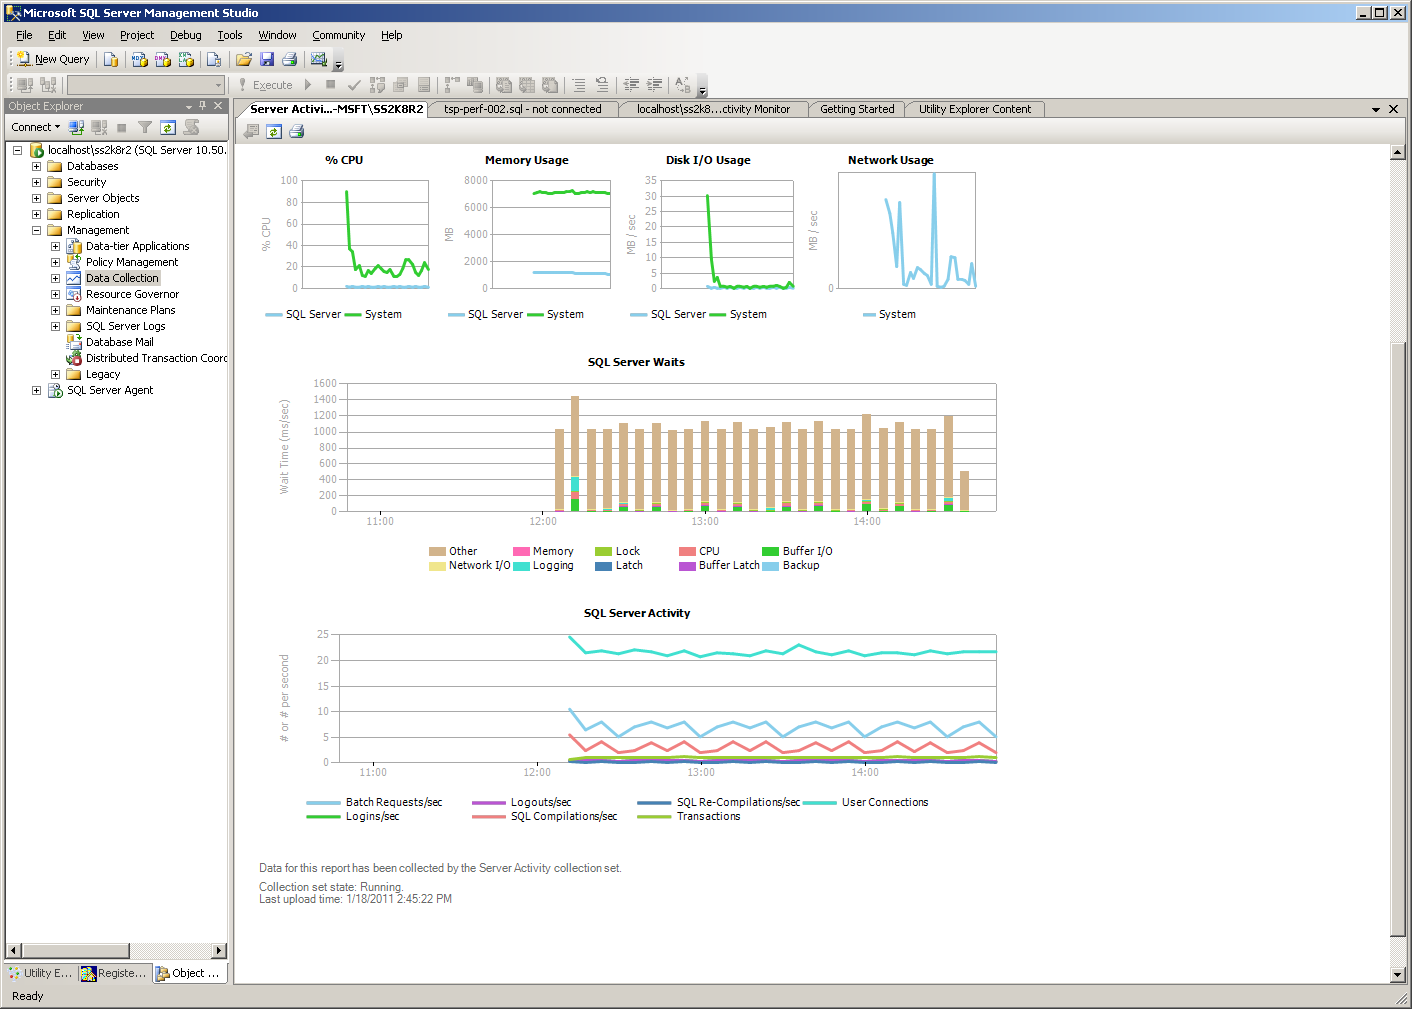
This one has gone through a few revisions and is an excellent part of the SQL Server 2008 R2 toolset that you can configure to run on your SQL Server simply by right-click and selecting “Configure Management Data Warehouse” on the Data Collector sets in your instance “Management” folder. The data collectors are configurable and will collect stats, typically at 15 minute intervals, across your instance databases for queries, server stats and disk stats. The MDW will also manage the archival of data history such that you can configure how much history to maintain online. Since this is a “data warehouse” and is based on data collectors that activate at set intervals, or on requested execution, the MDW is very good at providing history and baselines. In addition, the reports are all based on SSRS and include a rich set of reports out of the box that include drill-down to query text and query plans. Since these are SQL Server Reporting Services based performance reports for SQL Server, you can create your own MDW reports in SSRS as custom reports.

2. Utility Control Point
UCP is brand new in SQL Server 2008 R2 and with a single Data Center edition of the database, you can stand-up a monitoring server using just SQL Server and stay within SQL Server Management Studio. There are interactive dashboards that allow you to monitor SQL Server 2008 R2 databases using the data collectors mentioned above in MDW also within SSMS, making both of these closely related to each other and very easy for a SQL Server DBA because you can stay within your Management Studio environment.
In both the case of MDW reports and UCP, data is collected and pushed into a data warehouse and you should be cognizant of a possible hit to performance as well as data storage with all of these counters that are collected, processed and stored. UCP is a good candidate to stand alone in your environment and manage the servers centrally here.

3. Activity Monitor
Another tool that has gone through many SQL Server revisions, the SQL Server 2008 R2 version of Activity Monitor. Like MDW, you can get performance stats wih query details in the activity monitor. But unlike data collector driven tools like MDW & UCP, Activity Monitor produces real-time results in areas such as waits, processes and expensive queries. And unlike a data warehouse, the data is not persisted. The monitoring begins when you open Activity Monitor and ends when you close it.


Fonte:  mssqldude